Screen time has become part of the fabric of everyday life for most.
And many do not realize just how much time they are dedicating to phone screens, computer screens, and TV screens.
With that in mind, we’ll explore the latest screen time data to reveal insights focused on these areas:
- Average Screen Time Stats 2023
- Average Screen Time Overview
- US Average Screen Time
- Screen Time Changes Over Time
- Average Screen Time By Region
- Screen Time By Age
- Impact Of Screen Time
Average Screen Time Stats 2023
- Globally, people average 6 hours 58 minutes of screen time per day.
- Daily screen time has increased by nearly 50 minutes per day since 2013.
- The average American spends 7 hours and 4 minutes looking at a screen each day.
- South Africans spend 10 hours and 46 minutes on screen per day.
- Almost half (49%) of 0 to 2-year-olds interact with smartphones.
- Gen Z averages around 9 hours of screen time per day.
Average Screen Time Overview
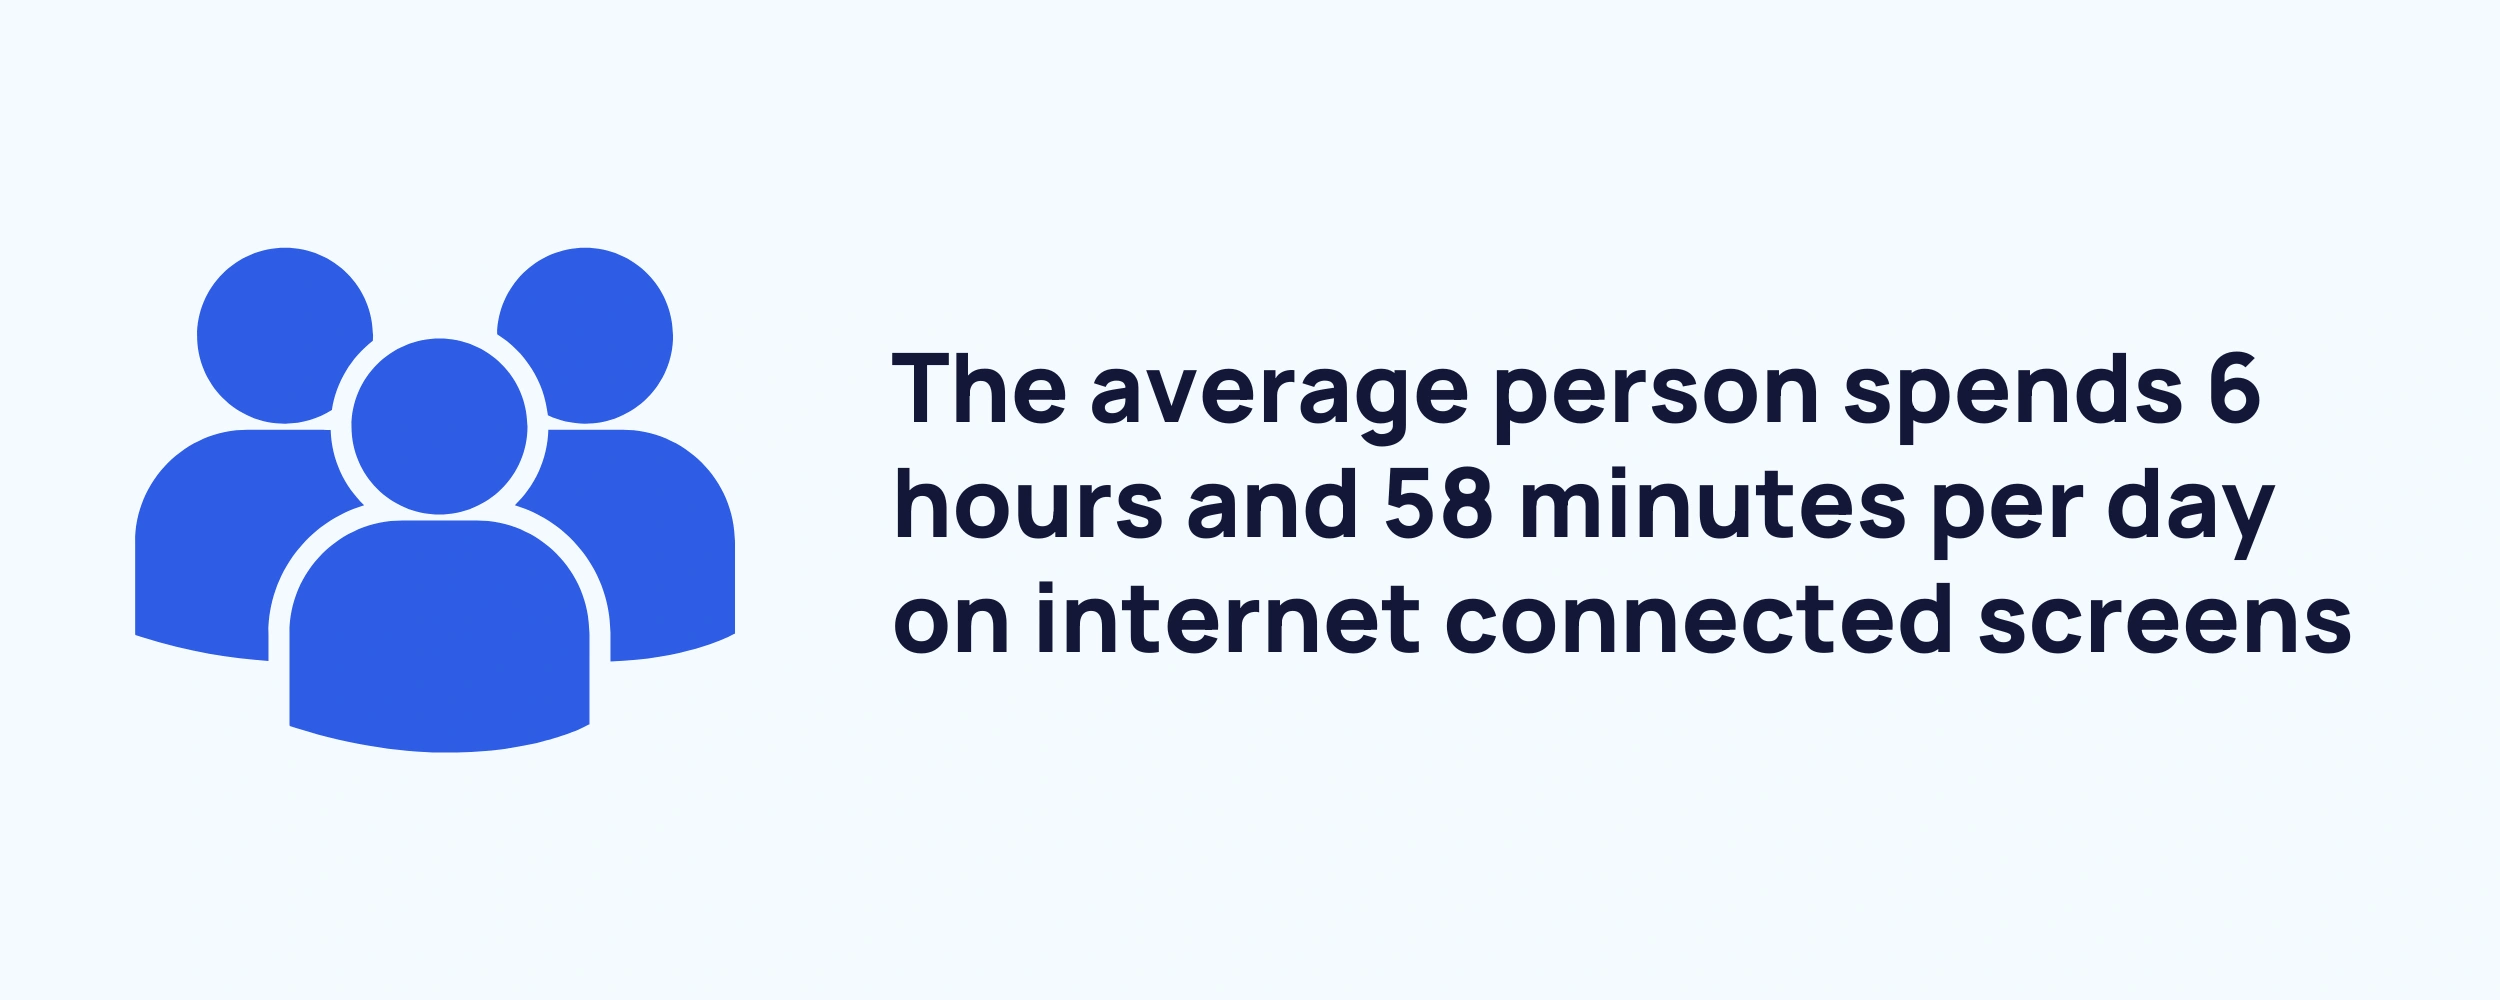
According to the latest available data, the average person spends 6 hours and 58 minutes per day on screens connected to the internet.
That’s a 1% (4 minutes) increase over 2021’s figure - equating to 5 billion+ days when extrapolated across all global internet users.
Overall, daily screen time is up 13% (49 minutes) since 2013.
Here’s a breakdown of the average internet-connected screen time since 2013:
| Year | Average Screen Time | Change Over Previous Year |
| Q3 2013 | 6 hours 9 minutes | - |
| Q3 2014 | 6 hours 23 minutes | ↑ 3.8% |
| Q3 2015 | 6 hours 20 minutes | ↓ 0.8% |
| Q3 2016 | 6 hours 29 minutes | ↑ 2.4% |
| Q3 2017 | 6 hours 46 minutes | ↑ 4.4% |
| Q3 2018 | 6 hours 48 minutes | ↑ 0.5% |
| Q3 2019 | 6 hours 38 minutes | ↓ 2.5% |
| Q3 2020 | 6 hours 54 minutes | ↑ 4% |
| Q3 2021 | 6 hours 58 minutes | ↑ 1% |
The latest figures suggest the average person spends upwards of 40% of their waking hours on an internet-connected screen.
And given the 30% jump between 2019’s mobile device screen time (2 hours 56 minutes) and 2021’s (4 hours 12 minutes), global screen time averages are likely to continue to grow.
Source: Data Reportal, Data Reportal, DigitalInformationWorld
US Average Screen Time
The average screen time in the United States is 7 hours 4 minutes per day - 7 minutes more than the global average according to Comparitech data.
The split between mobile and computer screen time is almost equal in the US. On average, 3 hours 30 minutes are dedicated to mobile devices, while 3 hours 34 minutes are spent on computers.
Here’s a comparison between the US and global screen time allocation:
| Country | Proportion Streaming TV | Proportion Playing Video Games | Daily Time Spent on Video Games | Daily Time Spent on Social Media |
| US | 91.6% | 80.9% | 1 hour 27 mins | 2 hours 14 mins |
| Global Average | 93.5% | 83.6% | 1 hour 12 mins | 2 hours 27 mins |
Somewhat surprisingly, the US is behind the world average in terms of the proportion of the population streaming TV (-1.9%) and the proportion of the population playing video games (-2.7%).
Daily time spent on video games is 15 minutes above average. But time spent on social media is 13 minutes lower than the global average.
Age clearly plays a significant role in screen time consumption as US teenagers spend over 3 hours per day watching TV or videos.
Here’s the full breakdown of how the average US teen distributes their daily screen time:
| Activity | Average Daily Screen Time |
| Watching TV/Videos | 3 hours 16 mins |
| Gaming | 1 hour 46 mins |
| Social Media | 1 hour 27 mins |
| Browsing Websites | 51 mins |
| Other | 29 mins |
| Video Chatting | 20 mins |
| E-reading | 15 mins |
| Content Creation | 14 mins |
And looking at this demographic in closer detail, the income also plays a notable role in screen time consumption.
American teenagers from lower-income households (<$35,000 annual household income) spend 9 hours and 19 minutes on their screens each day.
That’s 2 hours and 3 minutes more than the 7 hours and 16 minutes averaged by teenagers from higher income households ($100,000+ annual household income).
Sources: Comparitech, Common Sense Media
Screen Time Changes Over Time
From phones to tablets and smartwatches to TVs, screens are everywhere.
The vast majority are connected to the internet nowadays. And the average time spent using the internet via our screens is on the rise.
However, the rate of time increase isn’t the same across the board. And some countries have even seen a drop-off between 2021 and 2022.
Here’s the rate of change between average screen time in 2021 and 2022 for select countries:
| Country | Change in Screen Time |
| United Arab Emirates | ↑ 1.12 |
| Turkey | ↑ 0.44 |
| India | ↑ 0.42 |
| South Africa | ↑ 0.39 |
| Portugal | ↑ 0.37 |
| Egypt | ↑ 0.26 |
| Saudi Arabia | ↑ 0.21 |
| Thailand | ↑ 0.21 |
| Canada | ↑ 0.19 |
| Belgium | ↑ 0.16 |
| Brazil | ↑ 0.11 |
| Sweden | ↑ 0.06 |
| Switzerland | ↑ 0.04 |
| Ireland | ↑ 0.01 |
| Japan | ↑ 0.01 |
| Australia | - 0 |
| Taiwan | - 0 |
| Argentina | ↓ 0.01 |
| Israel | ↓ 0.02 |
| Russia | ↓ 0.02 |
| Austria | ↓ 0.04 |
| Colombia | ↓ 0.04 |
| Poland | ↓ 0.04 |
| Germany | ↓ 0.05 |
| China | ↓ 0.06 |
| Mexico | ↓ 0.06 |
| Malaysia | ↓ 0.07 |
| Spain | ↓ 0.07 |
| United States of America | ↓ 0.07 |
| South Korea | ↓ 0.08 |
| Vietnam | ↓ 0.09 |
| France | ↓ 0.12 |
| Italy | ↓ 0.12 |
| Denmark | ↓ 0.13 |
| United Kingdom | ↓ 0.13 |
| Indonesia | ↓ 0.15 |
| New Zealand | ↓ 0.17 |
| Romania | ↓ 0.17 |
| Netherlands | ↓ 0.18 |
| Hong Kong | ↓ 0.29 |
| Philippines | ↓ 0.29 |
| Singapore | ↓ 0.38 |
Source: Comparitech
Average Screen Time By Region
Screen time varies significantly by region. According to recent records from 43 nations, South Africa tops the charts for average screen time consumption per day.
The Philippines, Brazil, and Colombia each average 10+ hours per day too.
Here’s a closer look at 20 of the most active screen time users:
Country | Total Screen Time | Mobile Screen Time | % | Computer Screen Time | % |
South Africa | 10 hours 46 mins | 5 hours 9 mins | 48% | 5 hours 37 mins | 52% |
Philippines | 10 hours 27 mins | 5 hours 47 mins | 55% | 4 hours 40 mins | 45% |
Brazil | 10 hours 19 mins | 5 hours 25 mins | 53% | 4 hours 54 mins | 47% |
Colombia | 10 hours 3 mins | 5 hours 9 mins | 51% | 4 hours 54 mins | 49% |
Argentina | 9 hours 38 mins | 5 hours 4 mins | 53% | 4 hours 34 mins | 47% |
Malaysia | 9 hours 10 mins | 4 hours 49 mins | 53% | 4 hours 21 mins | 47% |
Thailand | 9 hours 6 mins | 5 hours 28 mins | 60% | 3 hours 38 mins | 40% |
Mexico | 8 hours 55 mins | 4 hours 37 mins | 52% | 4 hours 18 mins | 48% |
Indonesia | 8 hours 37 mins | 4 hours 56 mins | 57% | 3 hours 41 mins | 43% |
UAE | 8 hours 36 mins | 4 hours 35 mins | 53% | 4 hours 1 min | 47% |
Taiwan | 8 hours 7 mins | 4 hours 12 mins | 52% | 3 hours 55 mins | 48% |
Saudi Arabia | 8 hours 5 mins | 4 hours 35 mins | 56% | 3 hours 30 mins | 44% |
Egypt | 8 hours 2 mins | 4 hours 25 mins | 55% | 3 hours 37 mins | 45% |
Turkey | 8 hours | 4 hours 16 mins | 53% | 3 hours 44 mins | 47% |
Portugal | 7 hours 56 mins | 3 hours 34 mins | 45% | 4 hours 22 mins | 55% |
Russia | 7 hours 50 mins | 3 hours 39 mins | 47% | 4 hours 11 mins | 53% |
Israel | 7 hours 35 mins | 3 hours 31 mins | 46% | 4 hours 4 mins | 54% |
Singapore | 7 hours 28 mins | 3 hours 38 mins | 49% | 3 hours 50 mins | 51% |
India | 7 hours 18 mins | 4 hours 5 mins | 56% | 3 hours 13 mins | 44% |
Global Average | 6 hours 57 mins | 3 hours 43 mins | 53% | 3 hours 14 mins | 47% |
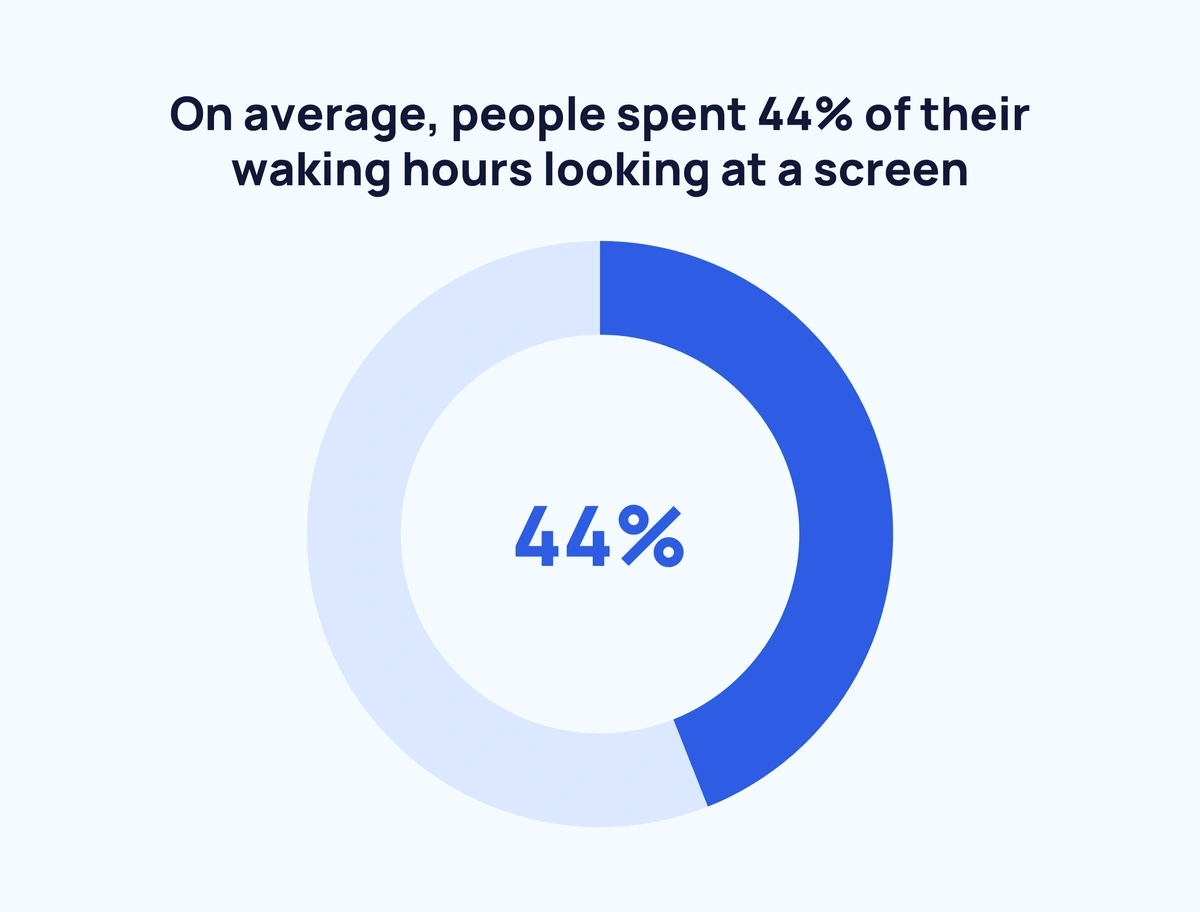
On average, people spent 44% of their waking hours looking at a screen.
Yet, in South Africa, this figure is closer to 70%.
While, in Japan, this proportion is far lower at just 28%.
As is evident from the above table, mobile and computer screen time is fairly evenly split. In fact, the five largest discrepancies each come from Asia:
- Thailand - 20% difference in favor of mobile screen time
- Indonesia - 14% difference in favor of mobile screen time
- India - 12% difference in favor of mobile screen time
- Saudi Arabia - 12% difference in favor of mobile screen time
The largest difference in favor of computer screen time is found in Portugal - 10%.
Globally, social media screen time and game console screen time are on the rise. But more traditional television (which includes streaming) viewing time is declining.
Below are figures for global average screen time allocation per day:
| Screen Time Allocation | Q3 2020 | Q3 2021 | 2020-2021 Change |
| Using Internet | 6 hours 54 mins | 6 hours 58 mins | ↑ 1% (4 mins) |
| Watching TV (inc. streaming) | 3 hours 24 mins | 3 hours 20 mins | ↓ 2% (4 mins) |
| Using Social Media | 2 hours 25 mins | 2 hours 27 mins | ↑ 1.4% (2 mins) |
| Using a Games Console | 1 hour 11 mins | 1 hour 12 mins | ↑ 1.4% (1 min) |
And here’s how the countries above compare in terms of each screen time allocation:
| Country | Proportion Streaming TV | Proportion Playing Video Games | Daily Time Spent on Video Games | Daily Time Spent on Social Media |
| South Africa | 96.6% | 90.2% | 1 hour 3 mins | 3 hours 43 mins |
| Philippines | 98.3% | 96.4% | 1 hour 34 mins | 4 hours 6 mins |
| Brazil | 97.7% | 89.3% | 1 hour 10 mins | 3 hours 41 mins |
| Colombia | 95.5% | 86.9% | 1 hour 6 mins | 3 hours 46 mins |
| Argentina | 96.7% | 86.6% | 1 hour 1 min | 3 hours 26 mins |
| Malaysia | 95.5% | 90.1% | 1 hour 13 mins | 3 hours2 mins |
| Thailand | 97.1% | 94.7% | 1 hour 58 mins | 2 hours 59 mins |
| Mexico | 97.9% | 91.2% | 1 hour 31 mins | 3 hours 20 mins |
| Indonesia | 97.1% | 94.5% | 1 hour 19 mins | 3 hours 17 mins |
| UAE | 93.9% | 90.3% | 1 hour 29 mins | 3 hours 4 mins |
| Taiwan | 94.8% | 91.6% | 53 mins | 2 hours 4 mins |
| Saudi Arabia | 95.9% | 91.4% | 1 hour 53 mins | 3 hours 24 mins |
| Egypt | 91.2% | 86.3% | 2 hours 3 mins | 3 hours 13 mins |
| Turkey | 96.4% | 91.5% | 1 hour 6 mins | 2 hours 59 mins |
| Portugal | 84.7% | 81.2% | 38 mins | 2 hours 28 mins |
| Russia | 84.5% | 78.6% | 30 mins | 2 hours 27 mins |
| Israel | 95.7% | 75.2% | 19 mins | 1 hour 58 mins |
| Singapore | 91.5% | 84.5% | 1 hour 11 mins | 2 hours 31 mins |
| India | 97.2% | 92% | 1 hour 21 mins | 2 hours 36 mins |
| Global Average | 93.5% | 83.6% | 1 hour 12 mins | 2 hours 27 mins |
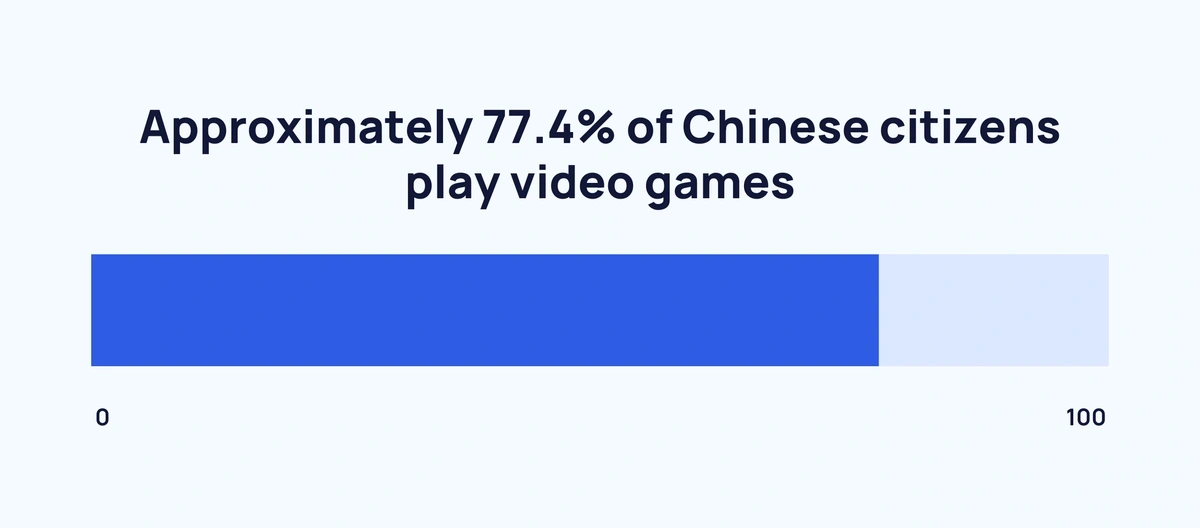
Approximately 77.4% of Chinese citizens play video games - 6.2% under the global average.
And an average of 1 hour 15 minutes is spent on games consoles - just 3 minutes above the world mean.
Nonetheless, the Chinese government is aiming to crack down on children’s screen time by limiting their play time to three hours per week. That equates to just under 26 minutes per day.
From the available data, Japan and Russia average the closest play time to that figure (30 minutes). And only Israel averages less (19 minutes).
Sources: Comparitech, DataReportal, Reuters
Screen Time by Age
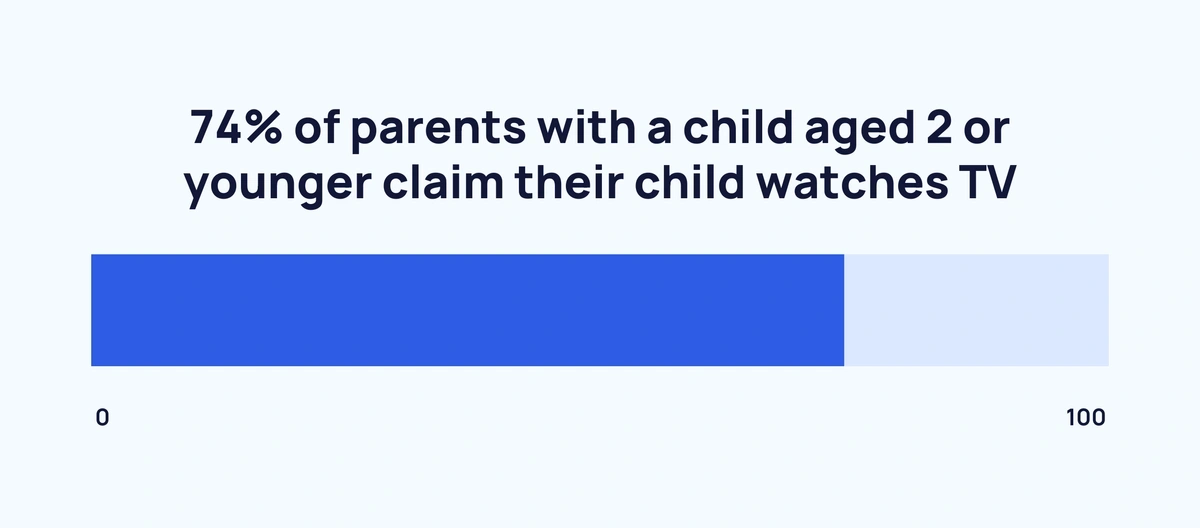
Age is an important factor in screen time consumption. Around 3 in 4 (74%) of parents with a child aged 2 or younger claim their child watches TV.
And 90% of older children spend time watching a TV screen.
Here’s a breakdown of the proportion of children who use certain devices according to the latest research:
| Age | TV | Tablet | Smartphone | Desktop/Laptop | Gaming |
| 0-2 years | 74% | 35% | 49% | 12% | 9% |
| 3-4 years | 90% | 64% | 62% | 21% | 25% |
| 5-8 years | 93% | 81% | 59% | 54% | 58% |
| 9-11 years | 91% | 78% | 67% | 73% | 68% |
| Total | 88% | 67% | 60% | 44% | 44% |
Almost across the board, there is a strong positive correlation between age and the proportion of children using a device.
Interestingly, the most passive screen time experience (watching TV) plateaued from the ages of 3-4 years onwards.
Whereas more active, and potentially demanding devices (desktop computers/laptops and gaming consoles) increased at a steady rate with age.
Perhaps unsurprisingly, young people spend more time in front of screens than average. In fact, a recent study revealed that Gen Z spends around 9 hours per day looking at a screen - approximately 2 hours more than the US and global average.
Source: PewResearch, Forbes
Impact of Screen Time
Data from a survey of 2,000+ US adults revealed that less than half the time spent on screens is believed to be productive.
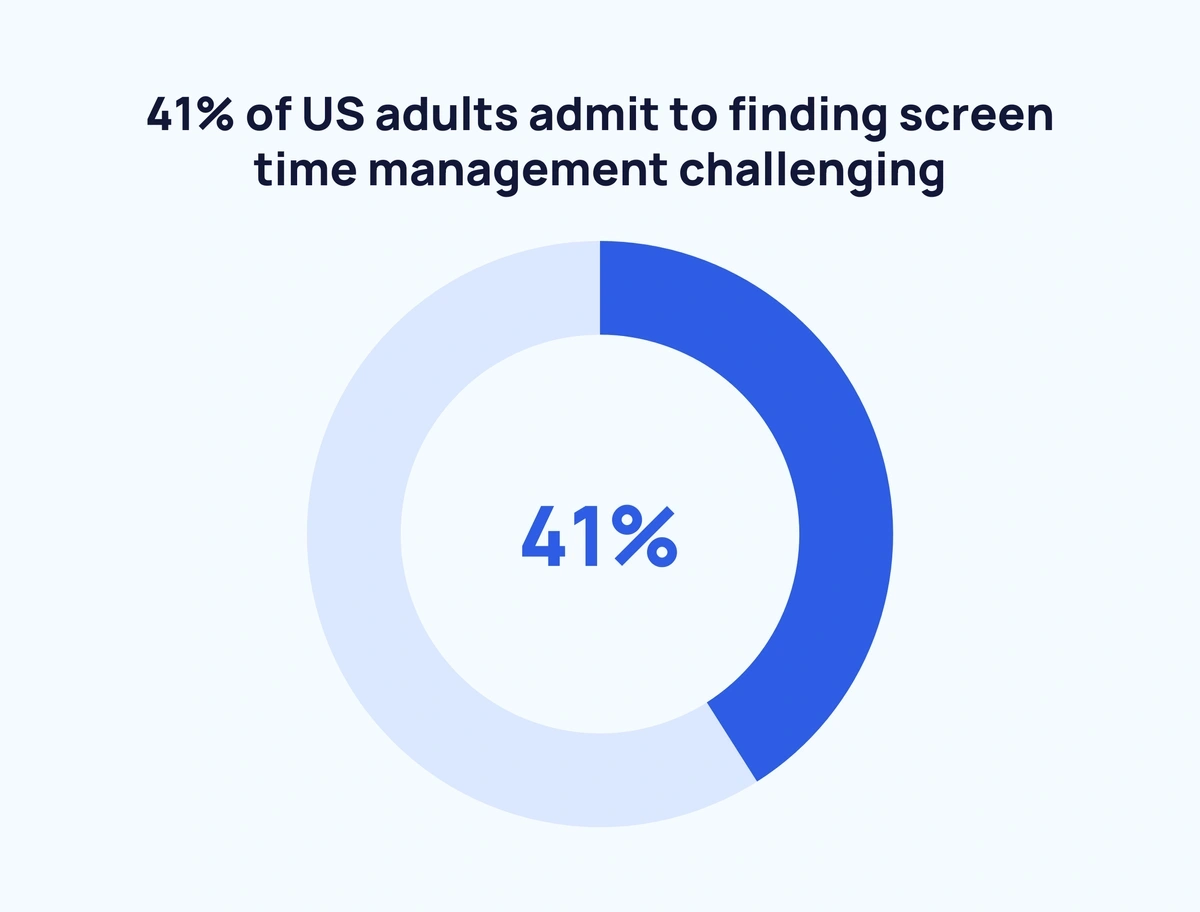
Furthermore, 41% admit to finding screen time management challenging.
And a concerning 21% feel guilty about how much time their children spend on screens.
Excessive screen time can have very real knock-on effects - especially in children.
Elementary-level school children who wrack up 2+ hours of screen time per day are more likely to suffer from social, emotional, and attentional issues.
On a more positive note, tens of studies have indicated that there is no significant correlation between screen time and academic performance.
However, a whole host of damaging side effects are linked with too much screen time, including:
- Sleep deprivation - Blue light interferes with melatonin production and disrupts the body’s circadian rhythm.
- Obesity - Data shows a strong association between screen time and obesity in children aged 5 to 17, most likely due to the sedentary nature of viewing a screen.
- Susceptibility to Type 2 Diabetes - In the UK, children aged between 9 and 10 who spend 3+ hours on the screen each day were more likely to show resistance to insulin
- Delayed learning - Young children who watch excessive amounts of TV can experience difficulties picking up the language.
In the wider population, limiting social media use to a maximum of 30 minutes each day has been linked with reduced depression and improved well-being.
Sources: People, AIFS, Mayo Clinical Health System, The Journalist’s Resource, Active Health, Quartz
Conclusion
Screens are inextricably linked with modern life. And the ways in which people spend their screen time are always evolving.
Whether the number of time people spend on screens increases, or sees a sudden reversal, remains to be seen.
If you enjoyed these stats, check out some of our other related content: 25 Startling Social Media Addiction Statistics, 20 Trending Social Media Startups, and Worldwide Daily Social Media Usage.
